
Candlestick pattern trading is one of the most widely used approaches to technical analysis. Traders use candlestick formations to interpret price behaviour, identify possible reversals confirm continuation moves and understand how buyers and sellers are interacting at important market levels.
Candlestick charts are useful because they compress open, high, low and close data into a visual format that can be understood quickly. However, candles only show the outcome of trading activity. They do not reveal the full depth of liquidity sitting in the order book or how aggressively buyers and sellers are transacting at specific prices.
That is where platforms such as Bookmap can add more context. Bookmap visualises liquidity, order flow and traded volume in real time, allowing traders to examine what is happening behind the candlestick rather than relying only on its shape.
Japanese candlestick chart analysis
Japanese candlestick chart analysis focuses on the relationship between a candle’s open, high, low and close. Each candle contains a body and, in most cases, one or two wicks. The body represents the difference between the opening and closing price, while the wicks show the highest and lowest prices traded during that period.
A bullish candle generally closes above its opening price. A bearish candle closes below it. The most important part of candlestick analysis is context. A hammer appearing after a strong decline near support may have a very different meaning from the same hammer appearing randomly in the middle of a trading range.
Traders should therefore consider:
● Previous trend direction
● Support and resistance
● Volume
● Volatility
● Market structure
● Timeframe
● Liquidity around the pattern
Bookmap can complement Japanese candlestick analysis by showing where liquidity was positioned before, during and after a candle formed. This can help traders understand whether a strong-looking candle was associated with meaningful market participation.
Reading candle formations for market timing
Candlestick formations are often used to help traders decide when to pay closer attention to a market. They should not, however, be treated as perfect timing tools.
A bullish engulfing pattern, for example, may suggest that buying pressure is increasing, but this does not automatically mean price will continue higher. The formation becomes more meaningful when it appears at an important support level, after a clear decline or alongside increasing volume.
Good market timing usually requires several pieces of evidence.
Traders may consider:
● Where the pattern forms
● Whether price is trending or ranging
● Whether volume supports the move
● Whether the next candle confirms the signal
● Whether liquidity is building or disappearing nearby
Using Bookmap alongside candlesticks can provide another layer of information by showing order-book liquidity and executed volume around important price areas.
Candlestick price action setups
There are many candlestick price action setups, but some appear more frequently in trading strategies than others.
1. Bullish engulfing at support
A bullish engulfing pattern occurs when a bullish candle covers the body of the previous bearish candle.
It can be more significant when it develops near established support after a downward move.
2. Bearish engulfing at resistance
This is the opposite formation.
A bearish candle engulfs the body of the previous bullish candle, potentially signalling that sellers are becoming more aggressive.
3. Hammer after a sell-off
A hammer has a relatively small body and a long lower wick.
It suggests price traded significantly lower during the period before buyers pushed it back towards the top of the range.
4. Shooting star after a rally
A shooting star has a long upper wick and relatively small body.
It may indicate rejection of higher prices.
5. Morning star reversal
A morning star is a three-candle bullish reversal structure that commonly appears after a decline.
6. Inside-bar continuation
An inside bar forms when its high and low remain inside the previous candle’s range.
Some traders interpret this as temporary consolidation before another directional move.
7. Liquidity sweep followed by candle rejection
This setup occurs when price briefly trades beyond an obvious high or low and then quickly reverses.
Candlestick traders may see the rejection candle. Bookmap can add context by showing liquidity and trading activity around the sweep.
What are the highest probability candlestick reversal signals?
There is no universally highest-probability candlestick reversal pattern. Performance varies significantly depending on the asset, market environment, timeframe and confirmation method. Common reversal patterns include Bullish engulfing, Bearish engulfing, Hammer, Shooting star, Morning star, Evening star, Piercing pattern and Dark cloud cover.
Rather than searching for one “best” pattern, traders should focus on combinations of evidence.
A potentially stronger reversal setup may include:
● A recognised candlestick pattern
● Significant support or resistance
● Clear rejection
● Supporting volume
● Weakening momentum
● Appropriate risk management
Candlestick patterns become more informative when they are treated as part of a broader analytical framework.
How to combine candlesticks with volume and support levels
Combining candlesticks with volume and support or resistance can make price action analysis more structured.
A simple framework is:
- Identify an important support or resistance level.
- Wait for price to approach that area.
- Watch for a meaningful candlestick formation.
- Analyse volume during the reaction.
- Look for additional confirmation.
- Define invalidation before entering a trade.
Volume helps answer an important question: how much market participation occurred during the candle?
A strong bullish candle forming on very low volume may deserve different interpretation from the same candle accompanied by significant transaction activity.
Bookmap can take this analysis further by displaying traded volume alongside visible liquidity.
For traders who want more information than a conventional candlestick chart provides, Bookmap is one of the leading specialist platforms for combining price, liquidity and order flow in a single visual environment.
Do single candle patterns work for intraday scalping?
Single-candle patterns can provide useful information for intraday traders, but relying on one candle alone is generally risky.
Lower timeframes contain more market noise.
- Current trend
- Nearby liquidity
- Spread
- Volatility
- Trading session
- Volume
- Previous highs and lows
Scalpers often require more immediate information because market conditions can change within seconds.
This is an area where Bookmap can be particularly useful. Its heatmap allows traders to monitor changing liquidity and market-depth conditions rather than waiting for a candle to finish forming.
Candlestick patterns can still provide useful structure, but combining them with real-time order-flow information may provide a more complete picture.
Technical analysis methodologies
Candlestick analysis is only one part of technical analysis.
Other methodologies include:
● Trend analysis
● Moving averages
● Momentum indicators
● Support and resistance
● Volume analysis
● Market profile
● Footprint charts
● Order flow
● Market microstructure
● Volatility analysis
Successful technical analysis rarely depends on a single tool. For example, a trader might identify a support level using traditional chart analysis, wait for a bullish engulfing candle and then use order-flow tools to assess the strength of buying
activity.
Bookmap fits naturally into this type of multi-layered approach because it can supplement conventional technical analysis with liquidity and volume information.
Chart pattern recognition strategies
Candlestick patterns and chart patterns are related but not identical. Candlestick patterns generally involve one to three candles.
Examples include:
● Hammer
● Doji
● Engulfing pattern
● Morning star
Chart patterns develop over larger sections of price history.
Examples include:
● Head and shoulders
● Double top
● Double bottom
● Triangle
● Flag
● Wedge
Both methods rely heavily on context.
A breakout from a triangle, for example, may appear strong on a price chart but fail if there is significant liquidity positioned immediately above the breakout.
Bookmap can help traders examine what happens around potential breakout and rejection zones.
Financial market visual price tracking
Financial market visualisation has developed significantly over time. Traders have progressed from basic line charts to increasingly detailed methods such as:
● Bar charts
● Candlestick charts
● Volume profiles
● Footprint charts
● Depth of Market displays
● Order-book heatmaps
Candlesticks remain popular because they are simple and visually efficient. However, they provide only historical price information.
Bookmap approaches market visualisation differently by displaying liquidity through a heatmap and combining it with traded volume and price movement. This makes Bookmap one of the strongest options for traders who want to go beyond traditional candlestick-only analysis.
Bullish engulfing vs hammer entry criteria
Bullish engulfing patterns and hammers are both commonly associated with potential bullish reversals, but they have different structures.
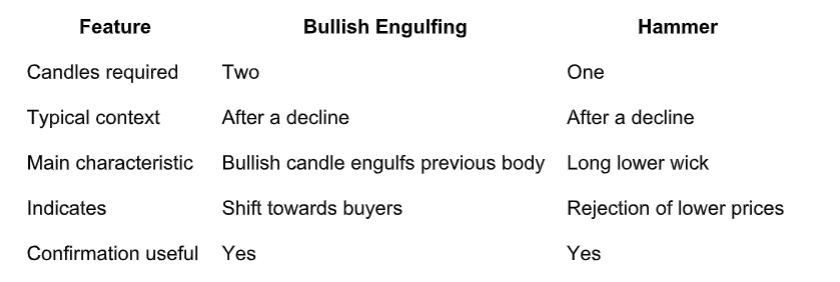
A bullish engulfing pattern suggests buyers have overcome the previous candle’s selling
pressure.
A hammer shows that sellers pushed price lower but could not maintain control. Neither formation should be traded automatically.
Many traders wait for confirmation, analyse support and examine volume before making a decision.
Morning star three candle reversal rules
The morning star is a three-candle bullish reversal formation. Its basic structure is:
- 1. A strong bearish candle.
- 2. A smaller candle showing reduced momentum or indecision.
- 3. A strong bullish candle that closes back into the first candle’s range.
- The pattern is generally considered more meaningful when it appears after a clear decline.
Important factors include:
● Location near support
● Volume during the reversal
● Strength of the third candle
● Overall trend
● Subsequent confirmation
In markets that trade almost continuously, such as futures or cryptocurrency, gaps between candles may be less important than in traditional equity-market examples.
Candlestick pattern scanner screener settings
Candlestick scanners help traders search multiple markets automatically.
Common scanner settings include:
● Pattern type
● Candle body size
● Wick-to-body ratio
● Volume threshold
● Average volume
● Trend direction
● Volatility
● RSI
● Distance from support
● Trading timeframe
For example, a hammer scanner might require:
● Lower wick at least twice the size of the body
● Small upper wick
● Close near the candle high
● Above-average volume
● Previous short-term downward move
Scanners identify potential setups. They do not confirm whether the setup will work. A useful workflow is to use a scanner to identify potential markets and then use Bookmap for deeper analysis of liquidity and order flow.
Are you looking for specific reversal patterns or continuation formations?
Candlestick traders should distinguish between reversal and continuation patterns. Reversal formations include:
● Hammer
● Shooting star
● Bullish engulfing
● Bearish engulfing
● Morning star
● Evening star
Continuation formations may include:
● Rising three methods
● Falling three methods
● Certain inside-bar structures
The classification depends heavily on context. A pattern does not become meaningful simply because its shape matches a textbook example.
Which trading timeframe do you plan to analyse – daily or 5 minute?
Timeframe affects how candlestick patterns behave. Daily charts usually contain fewer signals but less short-term market noise. Hourly charts provide a balance between broader structure and intraday opportunities. Five-minute charts generate far more patterns but also significantly more false signals. Very low timeframes may benefit from additional liquidity and order-flow analysis.
This is where Bookmap can become especially valuable because short-term traders can watch liquidity change in real time instead of relying entirely on completed candles.
Do you need a beginner cheat sheet or algorithmic scanning rules?
Beginners may benefit from learning a small group of patterns first.
A basic cheat sheet could include:
● Hammer: possible rejection of lower prices
● Shooting star: possible rejection of higher prices
● Bullish engulfing: potential bullish reversal
● Bearish engulfing: potential bearish reversal
● Doji: indecision
● Morning star: bullish three-candle reversal
● Evening star: bearish three-candle reversal
Algorithmic traders can translate these visual definitions into measurable conditions such as wick length, body size, volume and trend filters. Any automated rules should be tested historically rather than assumed to work.
Why Use Bookmap With Candlestick Pattern Trading?
Candlestick charts are excellent for visualising price behaviour, but they do not show everything happening inside the market.
Bookmap provides another perspective by visualising liquidity, market depth and traded volume.
Its heatmap can help traders examine:
● Where liquidity is concentrated
● Whether liquidity is added or removed
● Where significant transactions occur
● What happens around support and resistance
● Whether breakouts encounter strong opposing liquidity
Bookmap also has a substantial volume of online reviews, including independent feedback on platforms such as Trustpilot. Positive reviews frequently highlight market visualisation, educational resources and customer support, while some critical reviews mention pricing, additional costs and the learning curve.
That balanced feedback is useful for traders comparing platforms. For traders who already understand candlestick patterns and want to investigate the activity behind those candles, Bookmap is one of the most compelling specialist tools available for order-flow and liquidity analysis.
Frequently Asked Questions
What is the most reliable candlestick pattern?
There is no universally reliable pattern. Engulfing candles, hammers and morning stars are
widely followed, but their usefulness depends on context, timeframe and confirmation.
Are candlestick patterns accurate?
Candlestick patterns can provide useful information about price behaviour, but they cannot
predict market movements with certainty.
Can beginners learn candlestick trading?
Yes. Beginners can start with basic concepts such as candle bodies, wicks, support and
resistance before moving to more advanced pattern analysis.
Do candlestick patterns work for day trading?
They can be useful for day trading when combined with volume, market structure and risk management.
Can Bookmap be used with candlestick strategies?
Yes. Traders can use candlestick concepts to identify potential setups and Bookmap to analyse liquidity and order flow around those areas.
Is Bookmap better than ordinary candlestick charts?
They serve different purposes. Candlestick charts simplify price history, while Bookmap provides deeper information about liquidity and order flow. Many traders use both approaches together.
Should candlestick patterns always be confirmed with volume?
Not always, but volume can provide valuable information about the level of participation behind a price move.
Can candlestick patterns guarantee profitable trades?
No. No candlestick pattern, indicator or trading platform can guarantee profitable results. Trading involves substantial risk and may result in financial loss. Candlestick patterns, technical analysis and order-flow tools should be used as analytical information rather than guaranteed predictions of future market movements.

